I’ve recently decided to learn the basics of 3D computer graphics from the ground up. Prior to this I’ve assembled a decent working knowledge through making games and some 3D web projects. However, there have always been gaps in my knowledge which I’ve internally had to fill with “magic”. In my experience, the best way to dispel magic is by going back to basics. To that end, I picked up the book “Computer Graphics from scratch” by Gabriel Gambetta, and have been working through part II “Rasterization”. (Part I is all about ray tracing, which I may get to later, but wasn’t what I wanted to focus on.) This series will essentially be my rewrite of this book in my own words. Not because I want to infringe copyright, but because I think writing is a great way to learn. Anybody interested in this subject would be well advised to go through this book on their own. It goes into much greater depth, especially into the derivation of algorithms.
This is a project of doing things from scratch, so it doesn’t make use of any graphics APIs (webGL, vulkan etc). Indeed, basically all we’re doing is building very simple versions of these APIs.
The Big Picture
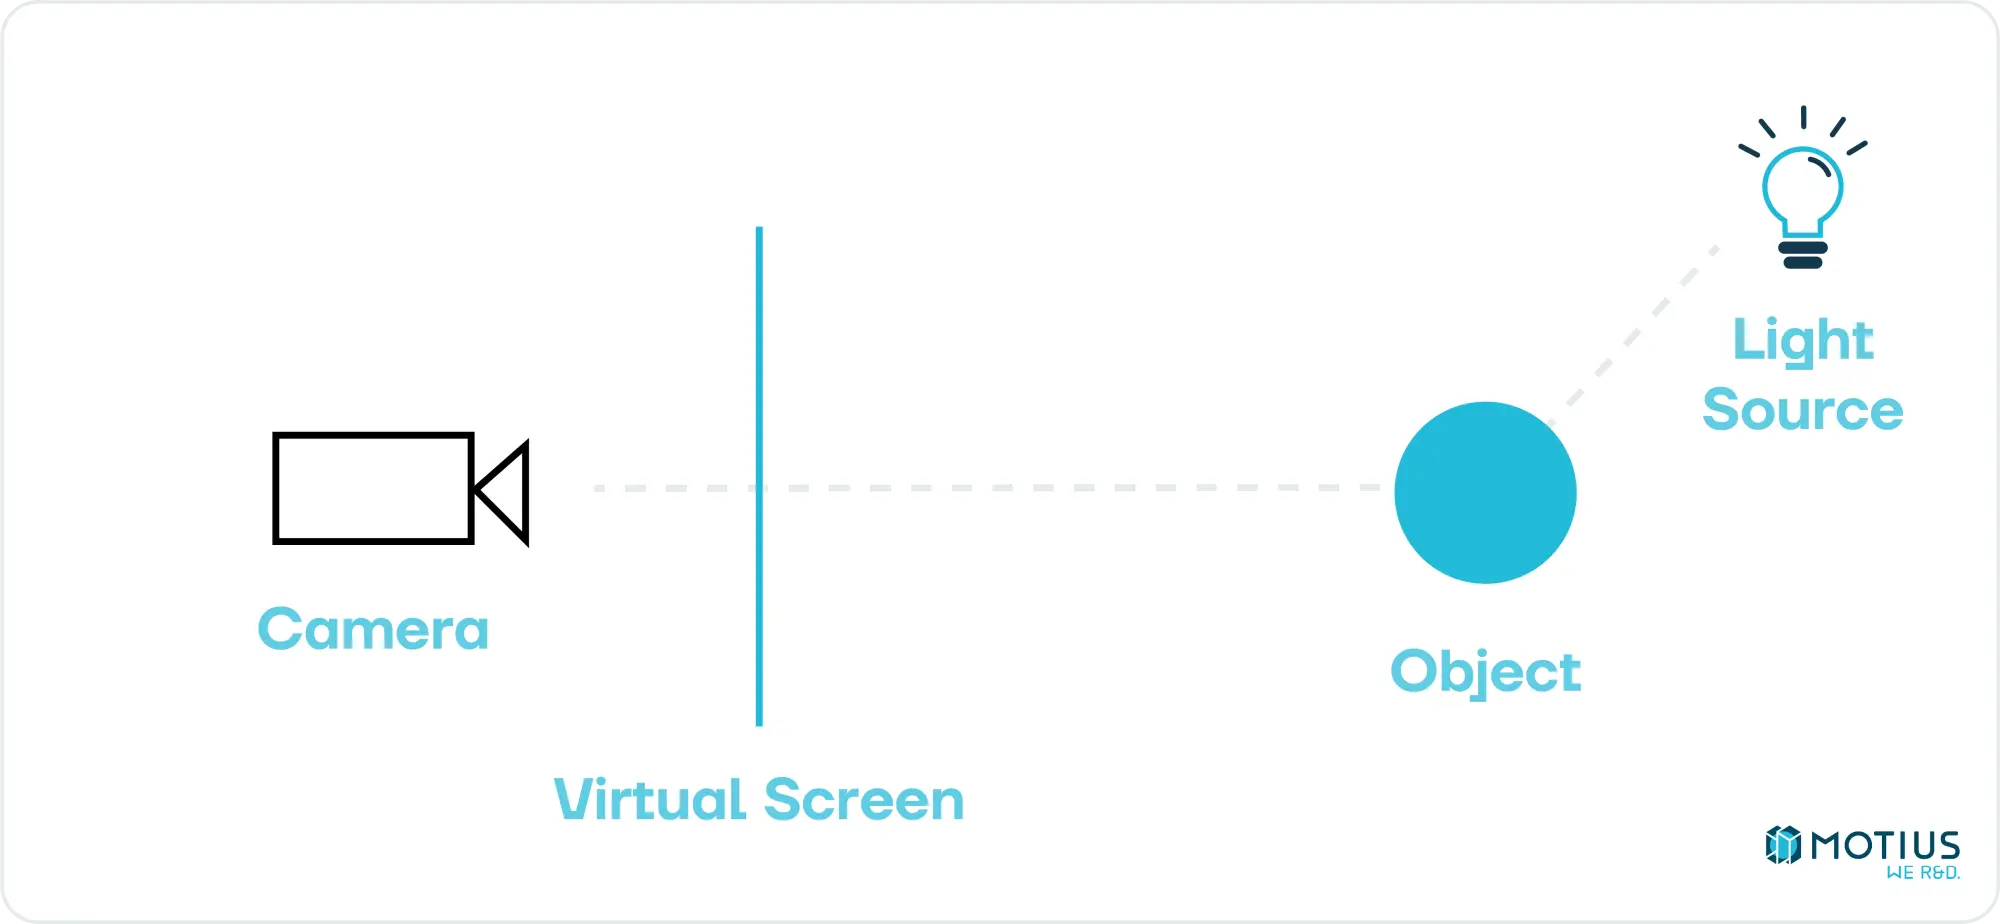
Before we dive into low level implementation, let’s consider what the goal is. We want to take some description of a 3D scene – a collection of objects & lights – and determine how this would look from a given camera angle. There are in general two ways of going about this. One is to go through each pixel and determine what path a photon would have had to take to land on it, and hence work backwards to figure out its colour.
This is called raytracing. While conceptually simple, it is very resource intensive (each pixel needs to cast a ray, which may bounce many times). It produces great results, but is generally too slow for real-time applications. Recently with the increasing power of GPUs, this has begun to shift a bit and raytracing is used together with our other approach in specific circumstances. But this is a study of basics, not the state of the art.
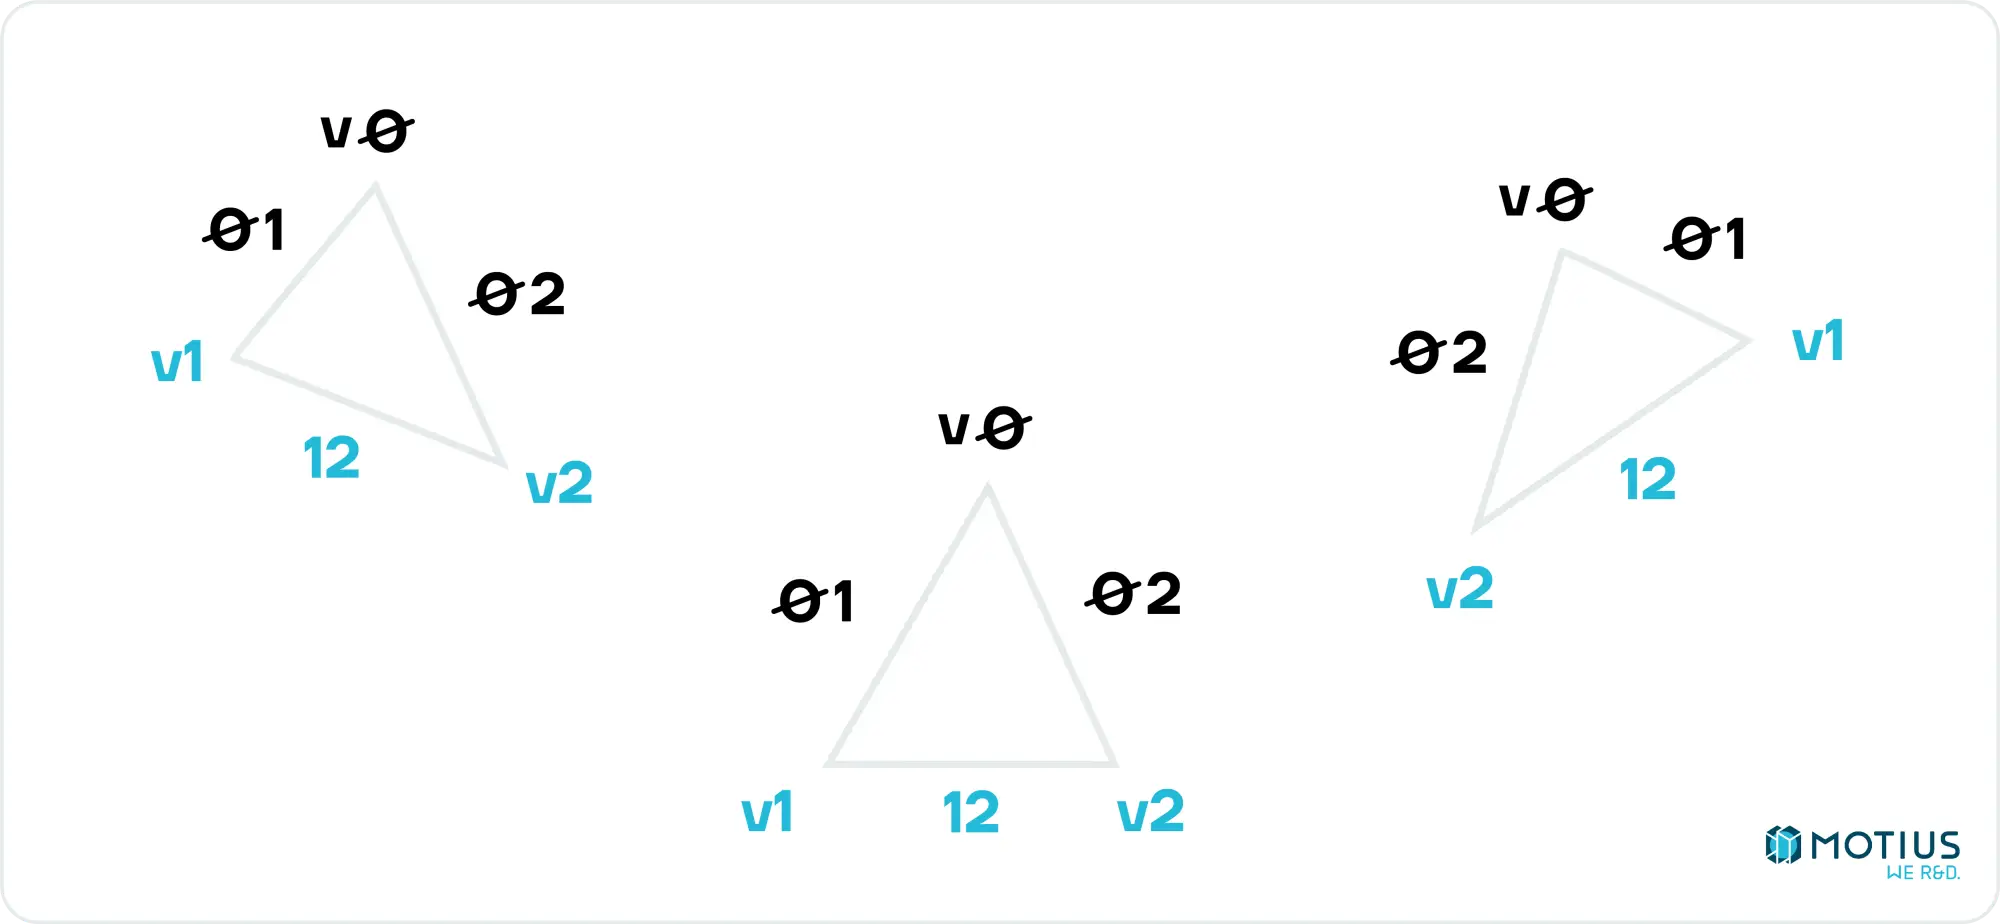
The other approach is known as rasterization. The main idea is to break the object up into simple parts, and then determine how that part would appear to the camera. The simplest 3D surface is a triangle, and hence this is normally used as our basic element (i.e. what we decompose complex objects down into). Any triangle in three-dimensional space can be projected onto a virtual screen, and will there be represented by a two-dimensional triangle (or a line segment, if the plane of the triangle is perpendicular to our screen):

So, if we know how to draw a triangle in 2D and how to perform the 3D → 2D projections we can draw any 3D shape, or at least an approximation of one. It will be composed of flat triangles. But there are some tricks we will get to later which will mostly hide this fact.
First, I will build up to drawing 2D triangles, and then we will get to performing 3D → 2D projections. Later installments in this series will go over some optimisations and lighting techniques to improve the fidelity of what we can draw.
Drawing Pixels
Before we can do anything else, we need to be able to draw a single pixel to the screen. How to do that depends on your setup. I’m going to use typescript in a browser, using an HTML canvas as my render target. This choice is entirely based on it being easy and using the tools I know well. We just need somewhere to start so we can get to interesting problems.
Will set pixel (x, y) to colour (r, g, b). There’s certainly more efficient ways to do this, but if we start down that path, we’d just end up using webGL. It does the job we need, and we need to pick our battles.
Note on my code snippets: many of my code snippets are edited for clarity within the context of the document. In practice I wouldn’t get the canvas and the context for each pixel I want to draw. That would be done once outside this function. Some snippets will also make use of types which I might not explicitly define, but consider obvious (for example, Vector2 should be simple enough. You might wonder if it’s an array or an object in javascript, but that will soon be clear by how it’s used).
I will share my full code at the end, but if you’re following along at home, you’ll need to use your brain a bit to make useful functions out of my snippets.
Coordinate Systems
This is a good point to discuss 2D coordinate systems. HTML canvas uses the following:

I.e. the top left corner is the origin. Down is the positive y direction, and right is the positive x direction. This is fairly standard in computer graphics (as the top left corner being [0, 0] makes sense, especially if you’re writing text, which I suspect is the age when this convention began).
My implementation will follow the example of my source textbook, and instead uses:
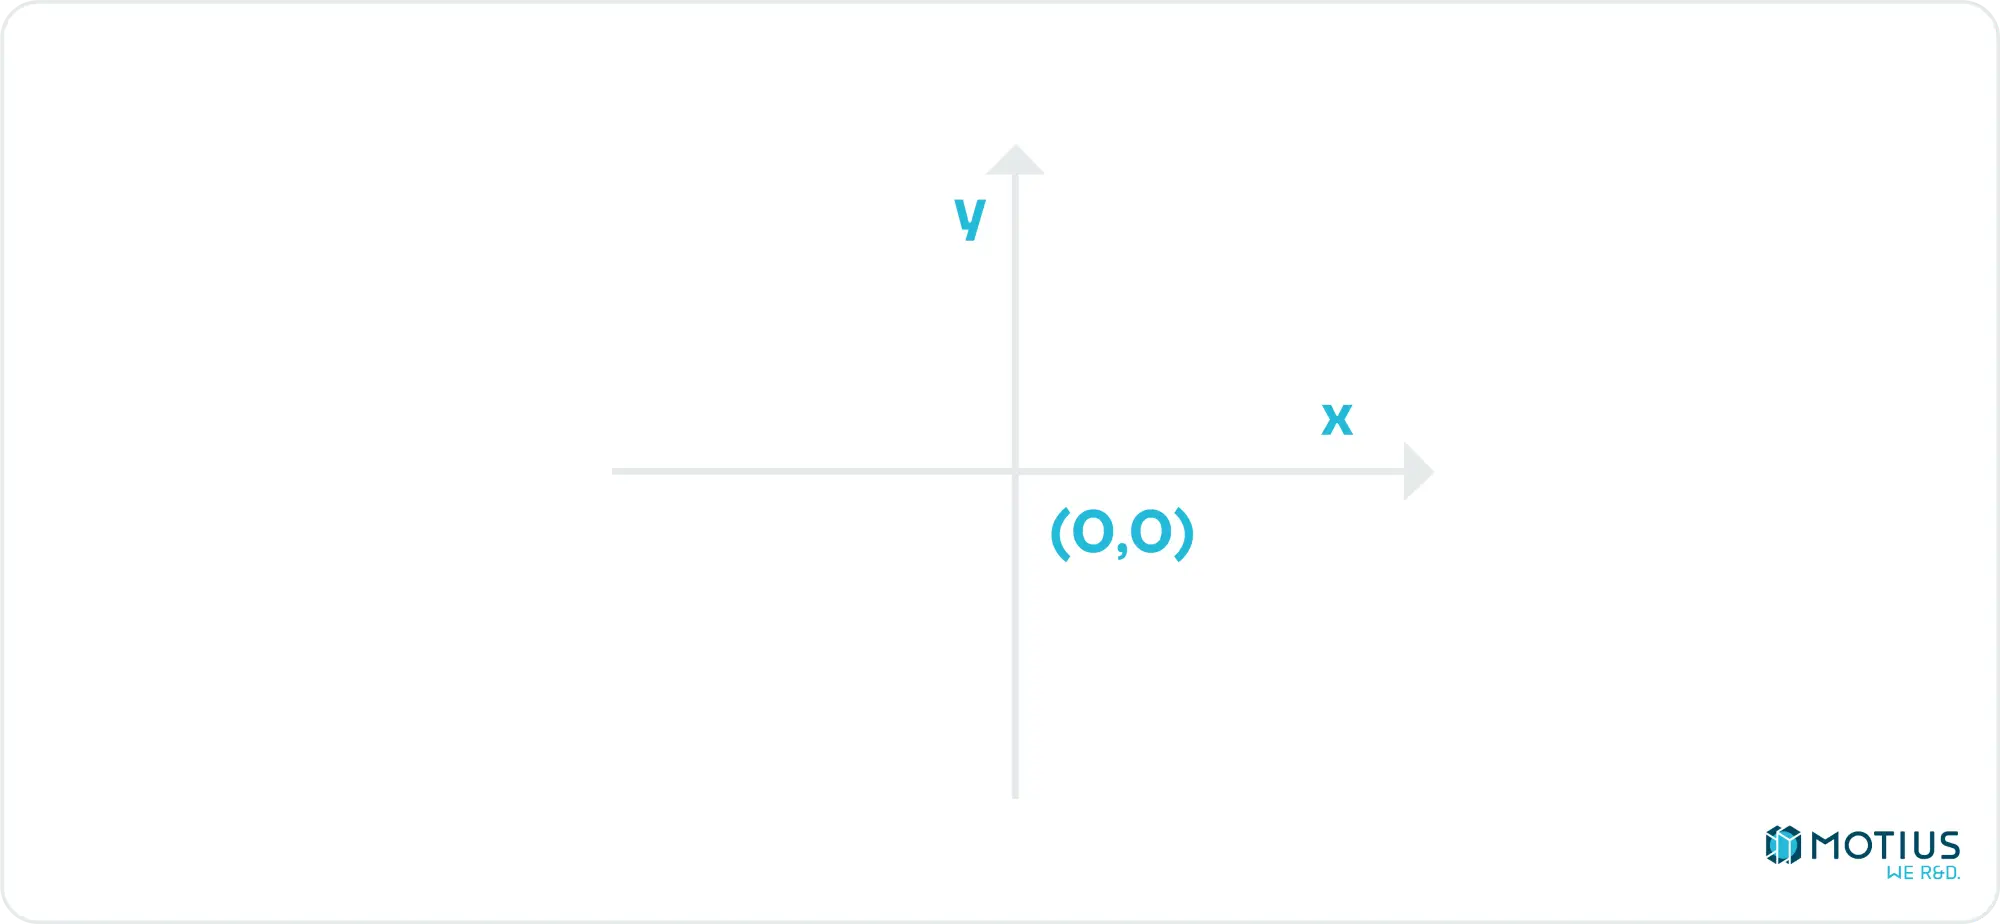
I.e. the center of the canvas is the origin. Right remains the positive x direction, but up is now positive y, as god intended.
From One to Two Dimensions: Drawing Lines
Going from drawing single pixels to horizontal or vertical lines is trivial, and as anyone who knows how analogue TV worked knows, if you can draw horizontal lines, you can draw anything. So we can skip this part, right?
Strictly speaking, yes. However, drawing lines is a very useful thing in a renderer (wireframes, arbitrary vectors etc.) So we will cover it quickly.
Diagonals of 45 degrees are only slightly more complicated than horizontal or vertical lines. Between these trivial cases, there are areas where for each x, we need to colour multiple y values (or vice versa). There is an algorithm called “Bresenham’s line algorithm” which does this very efficiently with only integer operations, making it very useful for computers.
In the specific octant of the slope going up and right, which are more horizontal than they are vertical:

The idea is to step through each x value, and determine which y value has its midpoint closest to the ideal line.

We do this by essentially storing how much upward movement has happened so far (sometimes referred to as error accumulation), and when there is enough, we bump up the active row. I don’t want to spend too long going over the details, as it can easily be searched and studied by the curious, I just wanted to mention it, as it’s an interesting algorithm. Here’s a javascript implementation of the single quadrant solution. It can be easily – if tediously – generalized to the full 2D plane.
Drawing 2D Triangles
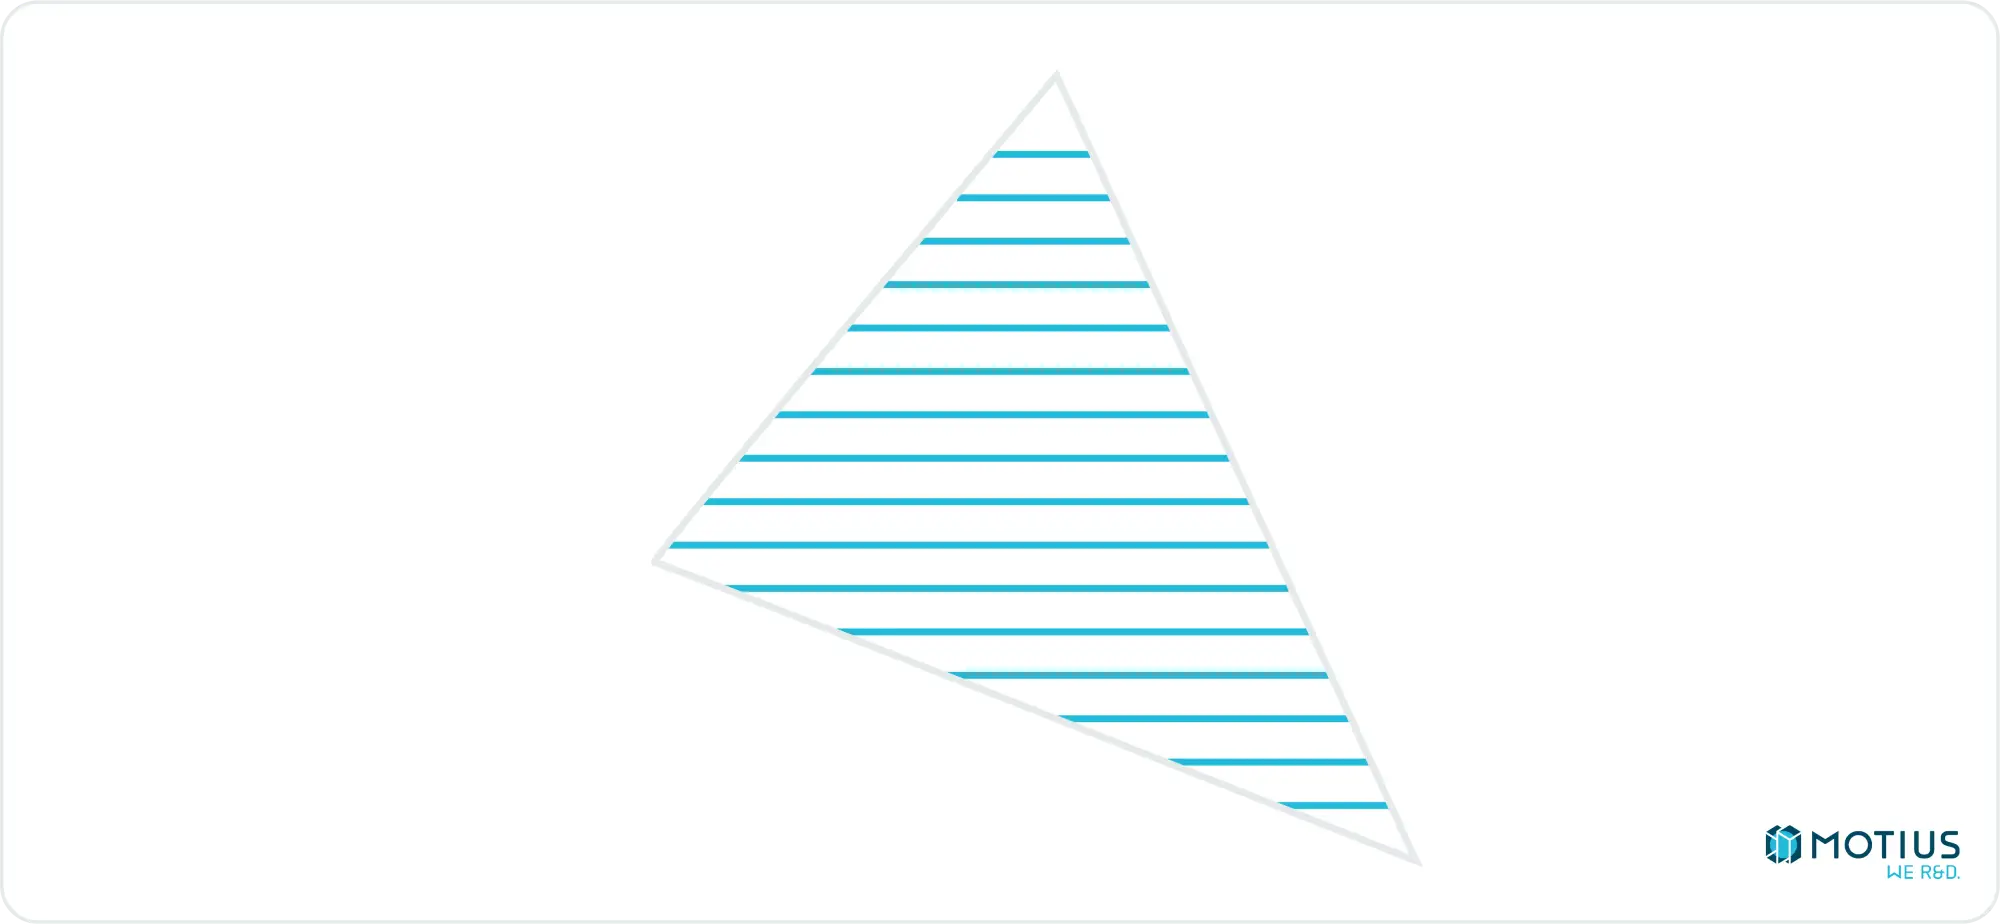
As previously mentioned, any 2D shape can be drawn using horizontal lines. The only shape we care about for our 3D renderer is triangles, so we’ll now look at how to decompose a 2D triangle into a series of horizontal lines.
If you look really closely at a screen rendering a triangle, you will see that it’s really just a series of horizontal lines. You’ll also hurt your eyes. Don’t do this.
To draw this series of lines, we first need to find the beginning and end point of each one. For the y coordinate, we’re simply iterating from the top most point of the triangle to the bottom most. We then need to find all x values on a given row. To do this, we could use Bresenham’s algorithm again. However I’m going to introduce a simpler, more generic linear interpolation algorithm here:
Where i0 & i1 are independent variables and always integers, and d0 and d1 are dependent variables and floats. The ability to deal with floats here is the main advantage over Bresenham’s algorithm. While it’s not strictly needed yet for our integer pixel coordinates, we will need floats later. Using the same algorithm for everything simplifies things.
Unless you’re a cyborg, or just much smarter than me, it’s probably not immediately obvious how the output of this function works, so lets take a simple example.
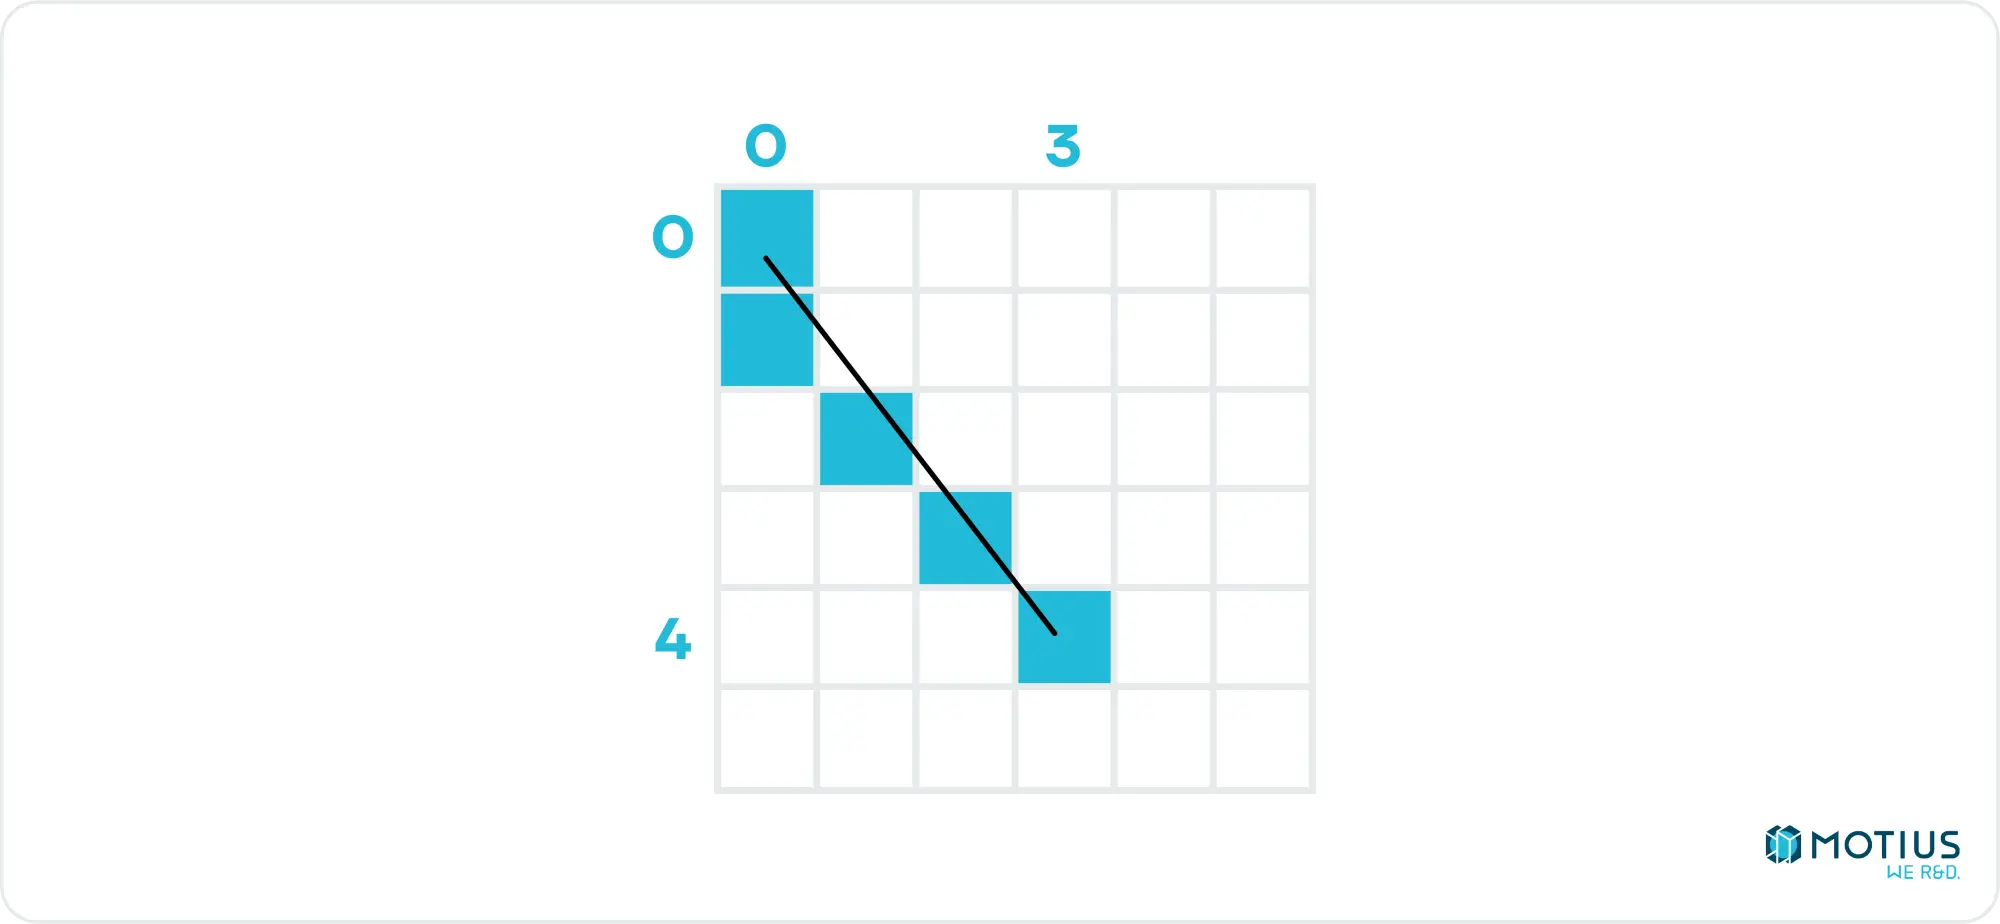
Interpolate(0, 0, 4, 3) will output [0, 0.75, 1.5, 2.25, 3]. But what does this mean? We’re saying that we have an independent variable going from 0 to 4, and we want the corresponding dependent variable for each value of the independent variable, where the first is 0, and the last is 3. That’s all a round-about way of saying the linear interpolation. If our independent variable is the y coordinate, and x the dependent variable, then we’ve just established the x values we need to draw a line from [0, 0] to [3, 4]. (We’d need to round the floats, naturally).
Back to our triangle. If we label the vertices v0, v1, v2, where v0 is the topmost and v2 the bottommost, we can see that either the left or right side will be given by the edge 02, and the other by the composite of 01 & 12 (unless v1 & v2 are at the same height, but happily that can be safely ignored, as it would contribute no lines to the rendered triangle).
If we calculate interpolate(v0.y, v0.x, v1.y, v1.x), we will get a list of all x values on the line 01, for each y value. We can do similarly for the other edges (and throw out the duplicate point from 01 & 12, to get two lists of x values. One is all of the values for the left hand side edges, and the other is the right edge. A simple comparison tells us which is which. This is everything we need to draw our triangle.
Coordinate Transformation
We’re now at the point that if we have a triangle defined in 2D, we can draw it, but how do we get from a 3D triangle to a 2D one? To describe a triangle in either scenario, we only need to describe the coordinates of three separate points. So the question then changes to how do we translate a 3D point into a 2D point given a camera position and rotation. Then we just do that 3 times.
Let’s start simple, with the camera at [0, 0], and facing in the direction of the positive Z axis. We define our rendering plane at some distance d from the camera, and it is of known size, both in screen pixels, and in world coordinates.
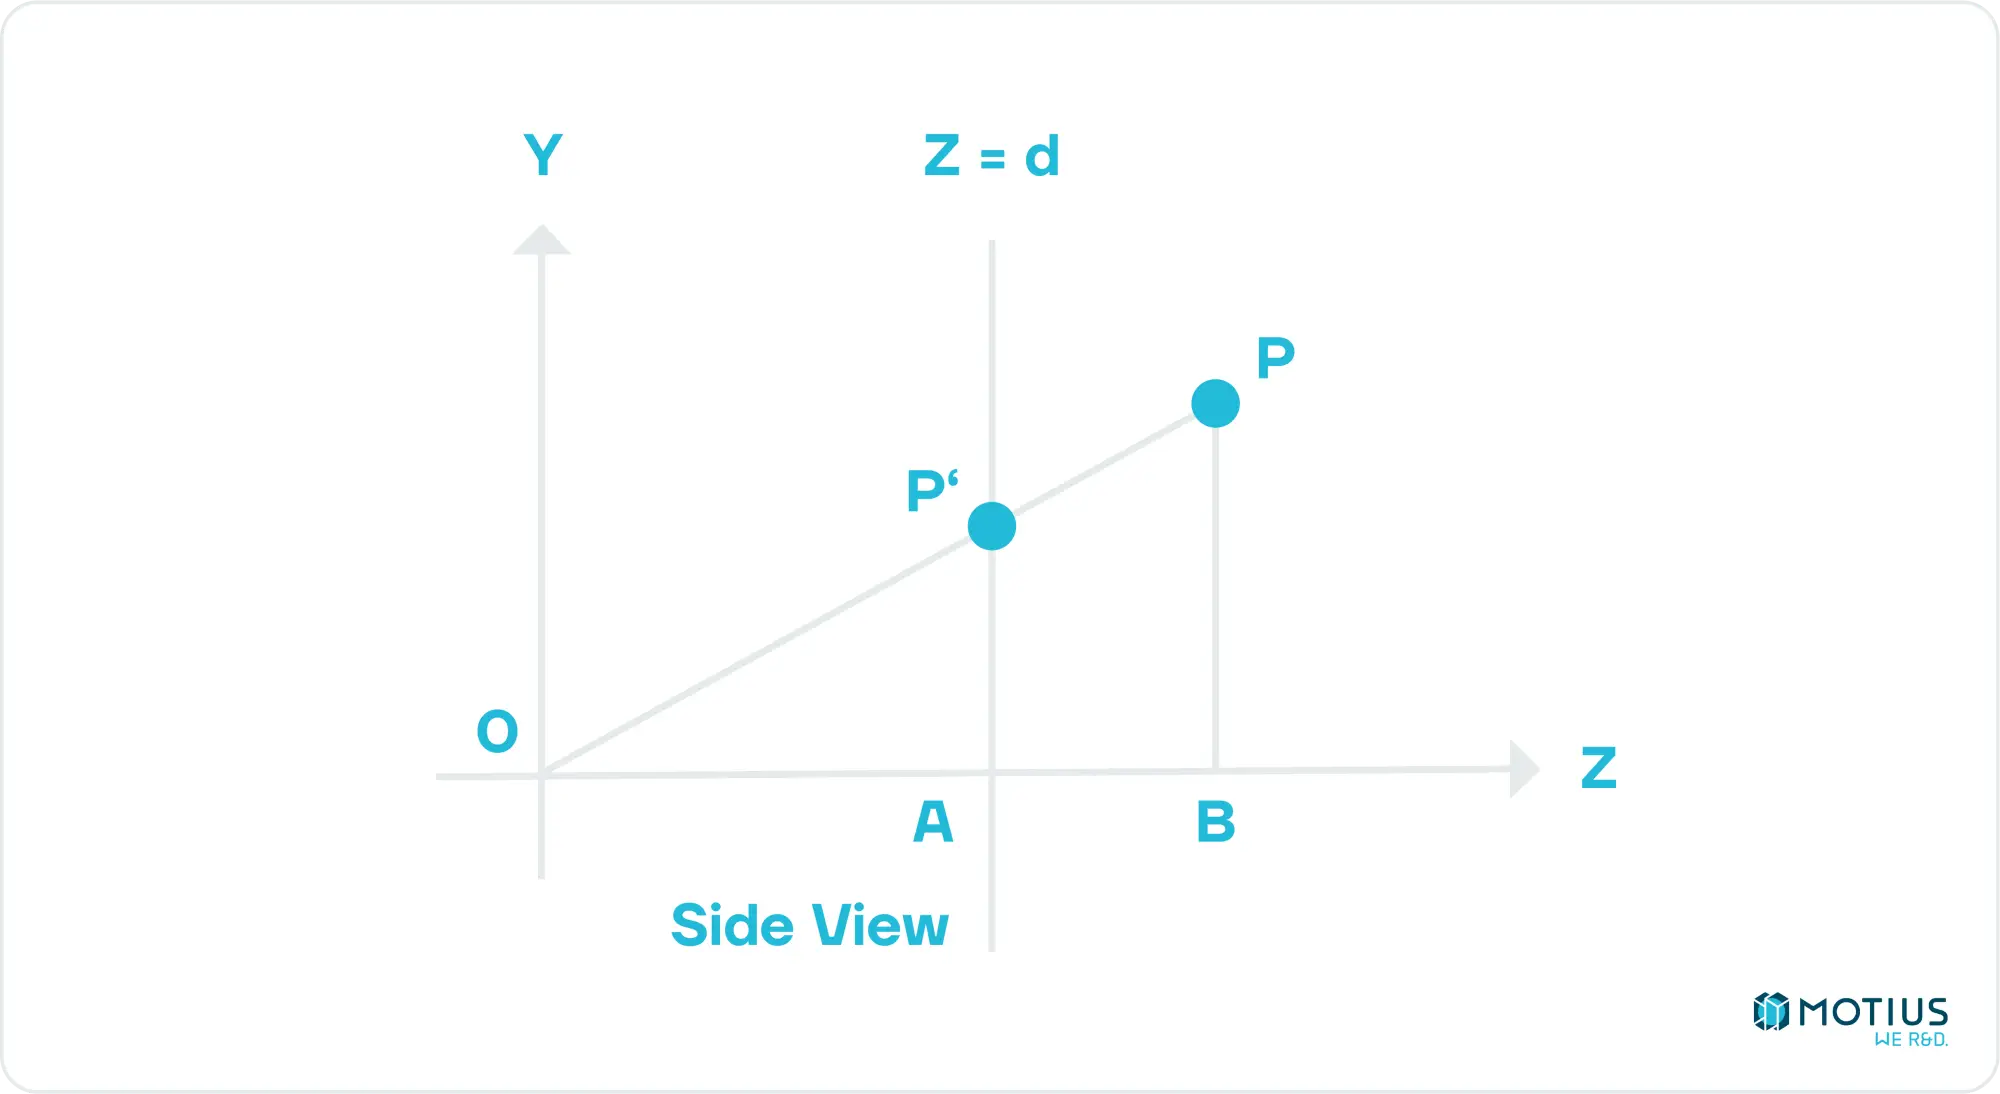
First, we want to find the position of our arbitrary point when projected onto our virtual screen from the perspective of the camera. We can then scale this onto our screen. From the image above, the Z coordinate of our projected point is obviously equal to d. To find the other coordinates, we can do some simple geometry to find that P'y = Py.d / Pz. Similarly, if we construct a similar view from the top down, we see that P’x = Px.d / Pz.
Translating this from the 3D coordinate space to our screen coordinate space is also quite simple. Both are rectangles of sizes we defined, so it’s just a matter of mapping from one to the other. If our viewport in 3D coordinates has height and width Vh and Vw respectively, and our canvas in 2D Ch and Cw, then the coordinates of our point on our screen should be given by Cx = P’x.Cw / Vw and Cy = P’y.Ch / Vh.
Enter the Matrix: Making the Interface More Friendly
The above method works, and achieves what we set out for in this installment. But for any scene more complex than a couple of individual floating triangles, it’s going to be a pain to actually use, and inefficient to boot.
Let’s take an example of a cube which can move around in space, and be observed from a camera which can also move. We can do the transformations each time, but we’re going to be repeating a lot. If we make use of some linear algebra, we can save ourselves a lot of pain and effort.
First, let’s organise our data a little. Our triangles are generally going to belong to some object. And each of the vertices within that object are going to be part of multiple triangles. We can define a structure to store this data like the following:
Where the Triangle type is just storing indices of the vertices which compose it. Further, since we said our objects could move, we need to store that movement information. (We’ll also let it be of different sizes while we’re at it).
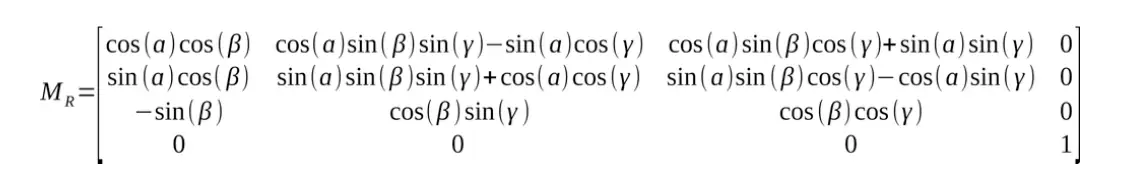
Where the rotation matrix is given by:
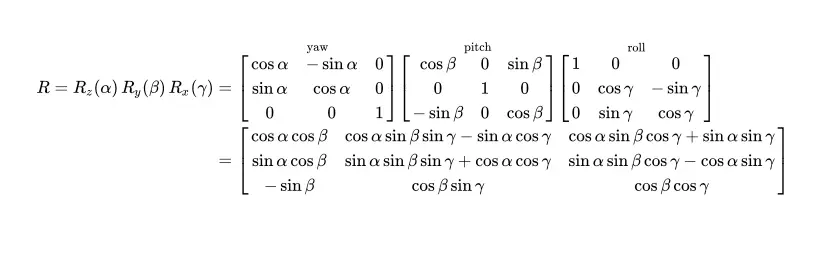
A rotation matrix is a way of representing a rotation in space. And that is a sentence which doesn’t say much. The above matrices are quite difficult to interpret at first, I think it becomes easier if we start in 2D.
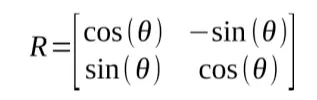
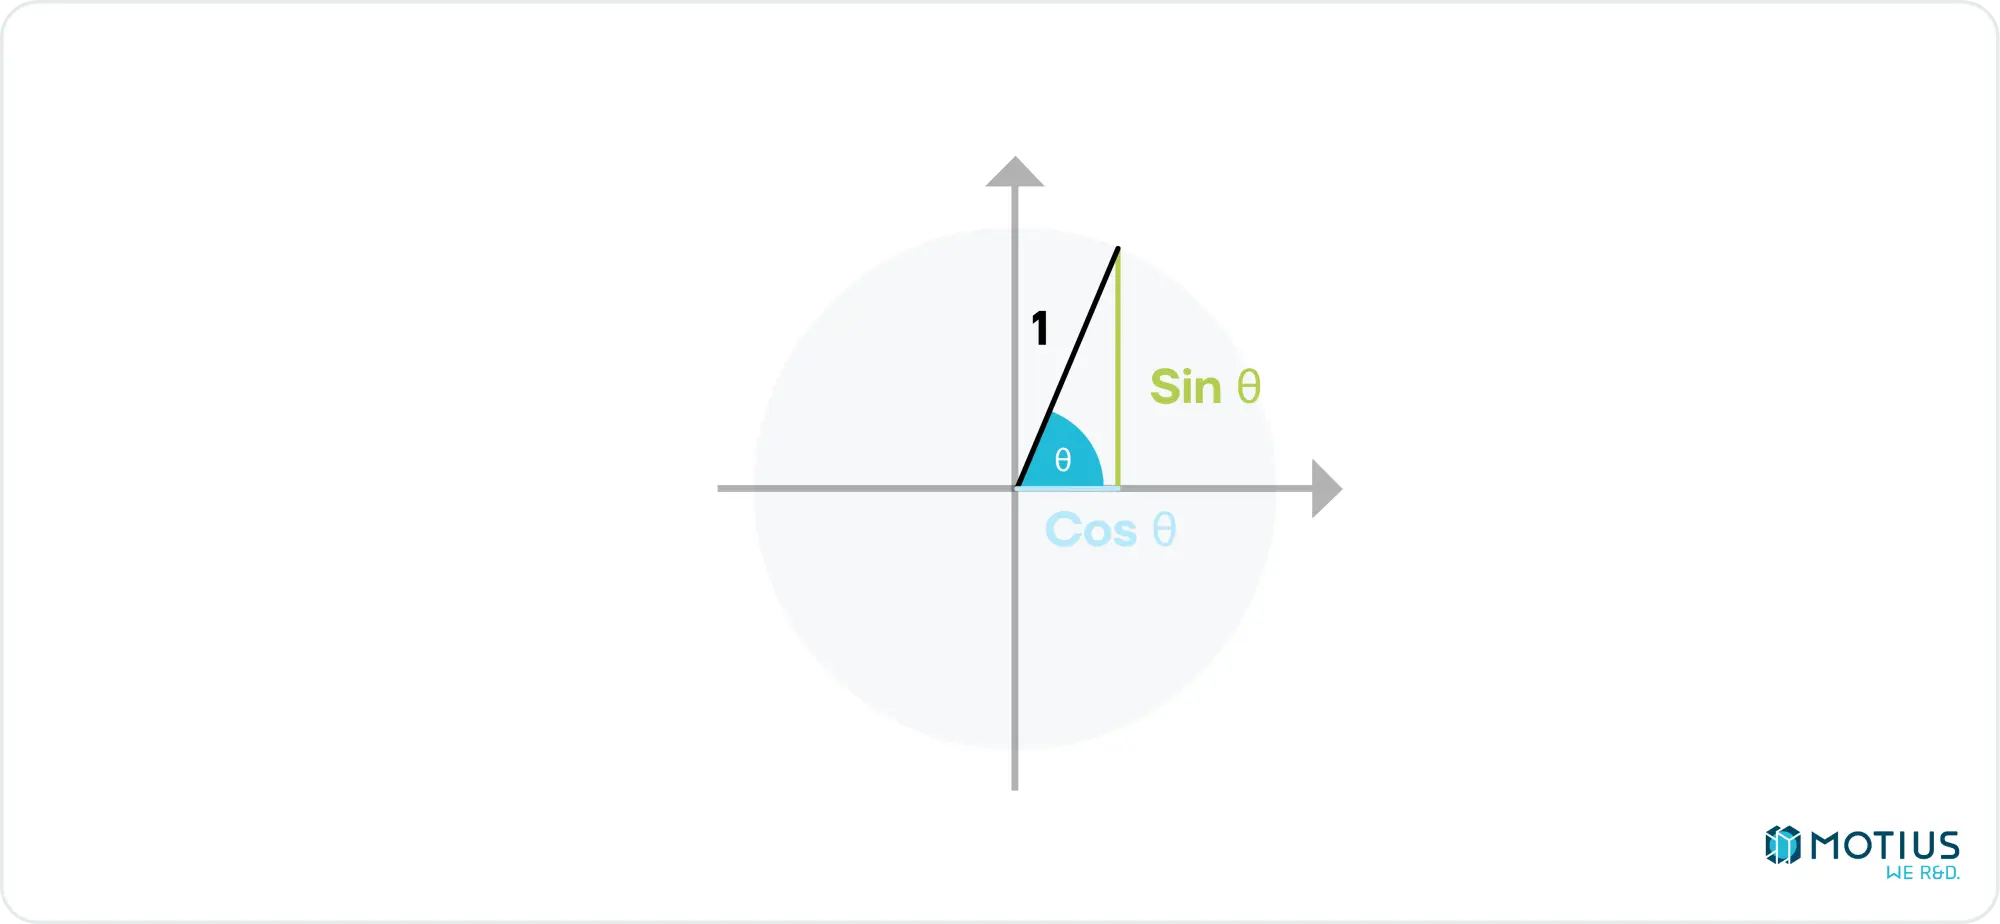
If we multiply this by a 2D point along the x axis
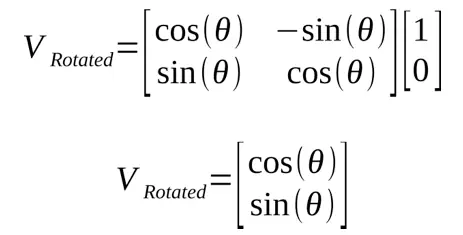
This result is the definition of sine and cosine in reference to the angle of rotation.
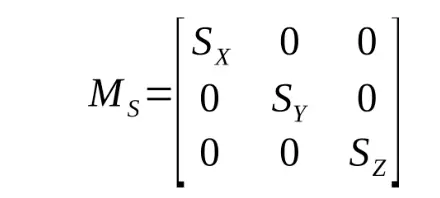
If you squint hard (or check wikipedia), you can see how you could get from the simple example here to the full 3D, 3-axis rotation matrix above. I don’t have the space here for a more detailed derivation, so if you’re still confused, check a linear algebra text book. In addition to rotation, we need to be able to scale and translate our object. Scale transformations are fairly trivial to perform with another matrix multiplication:
Translations are quite simple to represent by a vector addition:
However, if we could find a way to do this with a third multiplication, we can deploy a powerful trick. We could construct a single matrix for our model:
MModel = MT.MR.MS
When multiplied by the vector representing the position of a vertex relative to its parent model, this would give the position of the vertex in world space coordinates. We’d only need to recalculate this matrix once if the model moves, and can reuse it while it stays still, greatly reducing the computation needed per frame rendered.
Before we can find this multiplicative translation matrix, I need to introduce the concept of homogeneous coordinates. Consider the point (x, y, z). If you just use a Vector3 to represent this, you can’t tell whether it’s a vector, or a definite position. If we add a fourth field which acts as a sort of flag to tell that it’s a point, we’d instead have (x, y, z, w). If we treat w = 0 as a vector, and any other value as a point, then some interesting things happen. Subtracting two points gives the vector between them. Adding a vector to a point gives another point. This all makes sense. It’s important to note here as well that the same point can be represented by multiple values of w. If you divide the homogeneous vector through by the scalar w, you end up with w = 1, and this is known as the “canonical” representation of the vector.
Now with this concept in our pocket, you quickly see that rotation and scaling work the same by just adding a 4th row and column to our matrices, with a 1 on the diagonal, and 0s elsewhere (as rotating or scaling a point results in a point, and ditto for vectors):
But we still don’t have our translation matrix.
We need it to do the following:
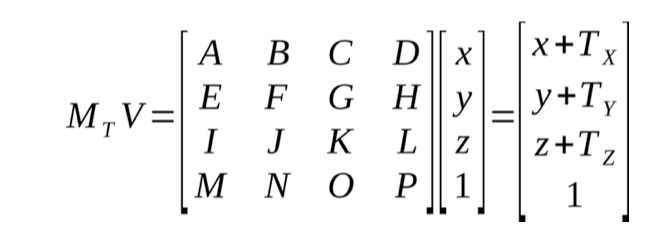
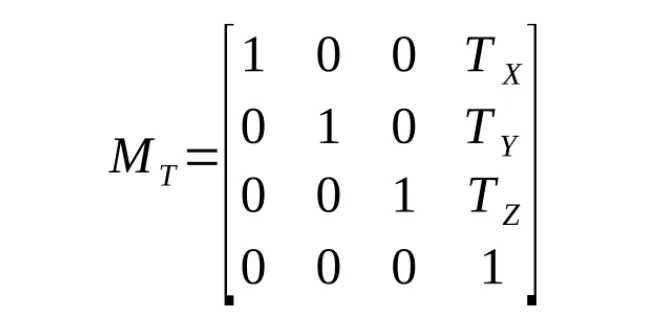
Reducing this to just the x value for simplicity:
Ax + By + Cz + D = x + Tx
Therefore, A = 1, and D = Tx. Similarly for the other coordinates, and we get our translation matrix:
Objects aren’t the only thing which can move. The camera can too. The effect this has on the position of the vertex on the screen is identical to if the object made the inverse transformation. So similarly, and doing everything backwards, we get:
MCamera = CR-1.CT-1
This needs to be updated only once per frame if the camera moves. With their powers combined, we can now calculate the position of any vertex relative to the camera:
VCamera = MCamera.MModel.VModel
To make the camera operations even simpler, we can actually cut a lot of that information down. Unless we want dutch angles, the camera is not going to roll. Scaling the camera also doesn’t really make much sense, so we’ll drop that. (I guess we actually just have that concept handled more explicitly with the canvas size.)
So, working our way back up, we can now get the camera matrix:
With this camera matrix, we can take our objects, and transform their triangles into camera-relative coordinates:
We can now feed these triangles into our draw3DTriangleToScreen function.
So we now have a fairly friendly API to draw any well defined model into our scene. But there’s a lot of wasted drawing going on, for example drawing pixels which are behind other pixels, and triangles which are entirely outside of the screen. If you were to use this code, you’d also discover some weird artefacts when the object is behind the camera. Everything is also made of singly coloured triangles, which has limited applications.
In the next installment, I’ll go over some optimisations, which also resolve the artefacts from objects behind the camera. In another future post I’ll go over adding lighting to the scene.